- Subscribe
- Digital Edition
-
Beverage Guide
- Flavor and Cocktail Construction >
- Production Fundamentals >
- Non-Alcoholic Beverages >
-
Beer
>
- Cider >
- Sake
-
Spirits
>
-
Wine
>
- Kamaʻāina Wine Makers >
-
Winemaking
>
- A Guide to: High Sugar Residual Wines
- A Guide to: Post Fermentation Flavor Adjustments
- A Guide to: Post Fermentation Process: Stabilization
- A Guide to: Wine Prefermentation Practices
- A Guide to: Wine Microbes
- A Guide to: Wine Alcoholic Fermentation Physical Environment
- A Guide to: Wine Fermentation Chemical Environment
- A Guide to: Wine Bottling
- A Guide to: Wine Faults
- A Guide to: Wine Polyphenols
- A Guide to: Wine Aroma Compounds: Pt 1
- A Guide to: Wine Aroma Compounds: Pt 2
- A Guide to Viticulture
- Red and White Grape Aroma Compounds
- Wine Styles >
- Business Strategy
- News and Events
- About
- Production Fundamentals
- Flower Aroma Compounds
- Flavor Pairing and Recipe Development
The non-alcoholic beverage market has been seeing exponential growth due to a combination of factors, including health awareness and better tasting options driven by modern technology. While this has been noted anecdotally, multiple studies also back up this premise.
General Industry Trends on Alcoholic Beverage Consumption
For this segment of the Guide, we have noted the following, which we highly recommend reading:
Gallup. (2022, July). Alcohol and Drinking: Gallup Historical Trends. Gallup News. Retrieved September 10, 2022, from https://news.gallup.com/poll/1582/alcohol-drinking.aspx
Gallup. (2022, July 26). Gallup Poll Social Series: Consumption Habits. Gallup News Service. Retrieved September 10, 2022, from https://news.gallup.com/file/poll/395909/220808Alcohol.pdf
Brenan, M., & Gallup. (2022, August 5). Most in the U.S. Say Alcohol Adversely Affects Drinkers, Society. Gallup News. Retrieved September 10, 2022, from https://news.gallup.com/poll/395867/say-alcohol-adversely-affects-drinkers-society.aspx
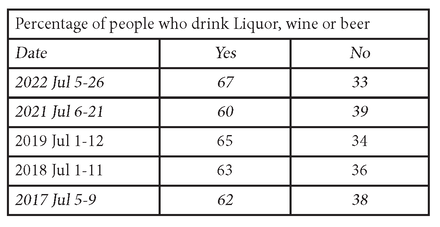
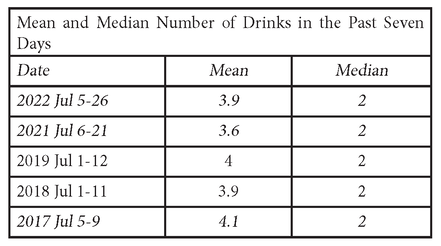
Gallup’s Alcohol and Drinking: Gallup Historical Trends, a great summary of alcoholic beverage trends over the past few decades, and Megan Brenan of Gallup’s commentary on the 2022 data Most in U.S. Say Alcohol Adversely Affects Drinkers, Society, provides insight into the yearly Gallup Poll Social Series: Consumption Habits for 1939 to 2022. In the 2022 study, telephone interviews of a random sample of 1,013 adults over the age of 18, living in all 50 U.S. states and the District of Columbia, were conducted from July 5-26, 2022. Of the 686 who drank alcoholic beverages and where the margin of sampling error is ±4 percentage points at the 95% confidence level, the study found:
|
Brenan noted that since Gallup started tracking alcohol use in 1939, the percentage of those who consumed alcohol was:
•>60% since 1997. •Reached a high of 71% in 1976, 1977 and 1978. The question was not asked in 2020, as COVID-19 lockdowns may have impacted drinking habits. •2022’s figure of 67% was a "slight uptick from last year, when alcohol use was at the low end of the narrow range of readings”. |
|
Brenan noted that among those who drink:
|
Other Resources and Suggested Reading
1. Jacobsen, J. (2022, March 23). 2022 Beer Report | Non-alcohol beer goes mainstream. Beverage Industry. Retrieved December 14, 2022, from https://www.bevindustry.com/articles/94806-beer-report-non-alcohol-beer-goes-mainstream
2. Noel, J. (2021, January 21). Nonalcoholic beer is having a moment, but can it last? Chicago Tribune. Retrieved December 14, 2022, from https://www.chicagotribune.com/dining/drink/ct-food-best-non-alcoholic-beer-dry-january-20210121-4bhwwwczunh7fbsog2aqgtmozm-story.html
3. Heineken. (2022, February 16). Heineken N.V. reports 2021 full year results. The Heineken Company. Retrieved December 14, 2022, from https://www.theheinekencompany.com/newsroom/heineken-nv-reports-2021-full-year-results/
No/Low Alcohol Beverage Trends
|
Of the various studies on the no/low alcoholic beverage trend, we have found the following the most insightful and have aggregated them. We highly recommend reading them in their entirety. They are:
CGA Strategy. (2022, February 28). No & low alcohol beer will be vital to category’s growth in the US, reveals latest OPM analysis. CGA. Retrieved September 10, 2022, from https://cgastrategy.com/no-low-alcohol-beer-will-be-vital-to-categorys-growth-in-the-us-reveals-latest-opm-analysis NielsonIQ & Wine Industry Advisor. (2021, October 12). NielsenIQ: Newly Released Low & Non-alcoholic Beverage Trends. Wine Industry Advisor. Retrieved September 10, 2022, from https://wineindustryadvisor.com/2021/10/12/nielseniq-newly-released-beverage-trends NielsenIQ. (2022, January 31). The sober curious movement is impacting what Americans are drinking. NielsenIQ. Retrieved September 10, 2022, from https://nielseniq.com/global/en/insights/analysis/2022/the-sober-curious-movement-is-impacting-what-americans-are-drinking/ IWSR. (2022, January). As Consumers Embrace ‘Dry January,’ No- and Low-Alcohol in Key Global Markets Reaches Almost US$10 Billion in Value. Retrieved September 10, 2022, from http://www.theiwsr.com/wp-content/uploads/IWSR-2022-No-and-Low-Alcohol-Press-Release.pdf IWSR. (2021). What’s driving growth in the no- and low-alcohol space? IWSR. Retrieved September 10, 2022, from https://www.theiwsr.com/whats-driving-growth-in-the-no-and-low-alcohol-space/ IRI. (2022, August). Beverage Alcohol Defies CPG Trends . IRI. Retrieved September 10, 2022, from www.iriworldwide.com/enus/insights/publications/beverage-alcohol-defies-cpg-trends Distill Ventures. (2019, May). The Rise of Non-Alcoholic Drinks. Distill Ventures. Retrieved September 10, 2022, from www.distillventures.com/insights-and-trends/non-alcoholic-drinks-a-growth-story |
from www.distillventures.com/insights-and-trends/non-alcoholic-drinks-a-growth-story
Wine Intelligence & Aswani, S. (2021, October 31). What are the opportunities for the no/low-alcohol wine category? Wine Intelligence. Retrieved September 10, 2022, from https://www.wineintelligence.com/what-are-the-opportunities-for-the-no-low-alcohol-wine-category/ General Non-Alcoholic Market Sales Data Global Sales IWSR (2022) analyzed the total sales in 10 focus markets, which represent over 75% of the global no/low alcohol consumption: Australia, Brazil, Canada, France, Germany, Japan, South Africa, Spain, the United Kingdom, and the United States. Total sales: Just under $10 billion (USD), up from $7.8 billion in 2018. Online no/low alcoholic beverage dollar sales increased in the latest 12 months: 315% vs a 26% increase in alcoholic beer, wine and spirits e-commerce sales. In 2020, these countries in the study gained 3% market share within the total beverage alcohol market. Of the countries studied, the largest consumers by volume were: 1) Germany
|
United States Sales
IRI (2022) reported U.S. Low/No Alcohol sales growth in dollars were:
2021 No/Low U.S. off-premise market: $3.3 billion (NielsenIQ, 2022). In the off-premise market in the 52 weeks ending 10/2021, according to NielsonIQ and Wine Industry Advisor 2021:
$331 million (+33.2%)
$2.77 billion (+8.1%)
$3.1 billion (+10.4%)
NielsenIQ (2022) reported that in the first two weeks of January, among the off-premise outlets in the U.S. that are tracked by NielsenIQ:
Predicted Growth
The IWSR (2022) forecasts that no/low-alcohol volume will grow by +8% compound annual growth rate (CAGR) between 2021 and 2025, compared to regular alcohol volume growth of +0.7% CAGR during that same period.
IRI (2022) reported U.S. Low/No Alcohol sales growth in dollars were:
- From 6-12-2021 to 6-12-2022: 6%
- From 6-12-2020 to 6-12-2021: 21%
- From 6-12-2019 to 6-12-2020: 20%
2021 No/Low U.S. off-premise market: $3.3 billion (NielsenIQ, 2022). In the off-premise market in the 52 weeks ending 10/2021, according to NielsonIQ and Wine Industry Advisor 2021:
- Non-alcoholic sales:
$331 million (+33.2%)
- Low-alcoholic sales:
$2.77 billion (+8.1%)
- Total no/low alcoholic sales:
$3.1 billion (+10.4%)
- “The market for no/low alcoholic beverages is still relatively small at less than 5% household penetration, but is an interesting area to watch, as it now represents $3.1B in sales and a 3.5% total alcohol market share,” noted Kim Cox, NielsenIQ SVP of Account Development.
NielsenIQ (2022) reported that in the first two weeks of January, among the off-premise outlets in the U.S. that are tracked by NielsenIQ:
- No- and low-alcohol sales totaled $106 million.
- Non-alcohol sales at $13.6 million (+19%).
- Low-alcohol products at $92.8 million.
- January 2022: Increase of 0.5% share of total alcohol sales, compared to 0.4% during the same time last year.
- Total alcohol sales are down 6.7%.
Predicted Growth
The IWSR (2022) forecasts that no/low-alcohol volume will grow by +8% compound annual growth rate (CAGR) between 2021 and 2025, compared to regular alcohol volume growth of +0.7% CAGR during that same period.
Consumer Demographics
|
Consumer Rational for Consumption of No/Low products
Consumers are purchasing and consuming BOTH alcoholic and no/low alcohol products during the occasion. This was noted by:
Moderation is the most common rationale for no/low alcohol product consumption. IWSR (2022) found across the focus markets:
NielsenIQ (2022) found 22% of consumers reported that they were cutting back on consuming alcohol and drinking less. The top consumer rationales were: “health and wellness, lack of opportunity and shifting interest.” Additionally, they note “wellness warriors – consumers who are prioritizing their wellness and well-being – are shifting the landscape. As seen with the rise of plant-based meats, the rise of no- and low- alcohol beverages may be taking a similar trajectory.” Consumption Occasions IWSR, (2022) found:
Non Alcoholic Beer and Cider: The No/Low Alcohol Market Driver Market Size
|
Current Growth Rate
Non-alcoholic beer/FMB/cider $ % change vs. one year ago: 31.7% (NielsonIQ/Wine Industry Advisor 2021) Low-alcoholic beer/FMB/cider $ % change vs. one year ago: 4.5% (NielsonIQ/Wine Industry Advisor 2021) CGA Strategy (2022) further notes:
Market Leaders by Brand [1] Heineken
O'Doul's (Anheuser-Busch InBev)
Budweiser Zero (Anheuser-Busch InBev)
Busch (Anheuser-Busch InBev)
Athletic Brewing
Anheuser-Busch InBev
|
Non Alcoholic Spirits: The Largest Growth
Market Size
Total Market Share of low/no alcohol category in 2020: 0.6% (ISWR 2021)
Current Growth Rate
Market Leaders
According to IWSR (2021)
Future Growth
Total Market Share of low/no alcohol category in 2020: 0.6% (ISWR 2021)
Current Growth Rate
- Non-alcoholic spirits $ % change vs. one year ago: 8.5% (NielsonIQ and Wine Industry Advisor 2021).
- The no/low spirits engagement grew from 8% in fall 2019 to 11% in fall 2021 (CGA, 2022).
- From 2020 to 2021, year-over-year sales in the non-alcoholic spirits category grew 113.4% on the delivery app Drizly, and overall category sales grew by 290%. NielsonIQ (2022) noted this growth outpaced the non-alcoholic beer, wine, and malt beverage segment.
- No/low RTD volumes grew in 2020, largely driven by a trend for functional alcohol-free RTDs in Japan (IWSR, 2021).
- Diageo’s venture capital fund, Distill Ventures, noted that the U.K., rather than the U.S. is setting trends, and highlighted that non-alcoholic spirits brands in the U.K. market grew from four to 42 in the six months between April 2018 and October 2018 (Distill Ventures 2019).
- ISWR (2021) found that increased volume consumption was driven by consumer home experimentation, new product development, and increasing consumer demand for no/low spirits, and that newer low-alcohol products like spirits and RTDs are particularly resonating with consumers in markets such as the U.S.
Market Leaders
According to IWSR (2021)
- Diageo’s Seedlip created the alcohol-free spirit category.
- Lyre’s Spirit Co.
- Pernod Ricard’s launch of Ceder’s.
- William Grant & Sons’ launch of Atopia.
- Diageo-owned Distill Ventures kicked off 2020 by making a minority investment in U.S.-based Ritual Zero Proof.
Future Growth
- No-alcohol RTDs and no alcohol spirits are both expected to post about +14% CAGR volume growth. (ISWR, 2022)
- The category should experience the largest volume CAGR rate from 2020 to 2024 (IWSR, 2021).
- Emily Neil, in IWSR (2021) states: “. . . the on-trade also lags in offering quality mocktails. Consumers want the interest, excitement and textures of a quality cocktail; they aren’t interested in a simple mix of juice and soda. If the on-premise can deliver a quality non-alcoholic drink, with all the flair, serve, garnishes, look and taste of a cocktail, they then have the potential to charge cocktail-equivalent prices as well. Instagrammability always helps too, especially with younger LDA consumers.”
Non-Alcoholic Wine
General Market
NielsonIQ/Wine Industry Advisor (2021)
Current Growth Rate
Nielsen’s CGA Strategy (2021):
Wine Intelligence and Aswani (2021) found in wine consumer data across all global markets:
IWSR’s Research Director, Daniel Mettyear, notes in IWSR (2021): “As we begin seeing more wine producers investing in meeting the growing demand for low- and no- alcohol, their main challenge will be in producing a wine alternative that delivers on taste. This has been a key barrier in non-alcohol wine becoming a mainstream alternative to date.”
Future Growth
IWSR (2022)
NielsonIQ/Wine Industry Advisor (2021)
- Non-alcoholic wine $ % change vs. one year ago: 39.4%
- Low-alcoholic wine $ % change vs. one year ago: 18%
Current Growth Rate
Nielsen’s CGA Strategy (2021):
- From Fall 2019 to Fall 2021 no/low wine consumer engagement increased from 8% to 13%.
Wine Intelligence and Aswani (2021) found in wine consumer data across all global markets:
- In mature global markets, one-third of regular wine drinkers are reportedly cutting back on alcohol consumption. This ranges from 36% in Japan to 58% in Switzerland.
- These consumers report that “looking after one’s health and wellbeing is the primary driver: calorie reduction, feeling better the next day, avoiding the stress of social awkwardness, a purer lifestyle. In Australia, Belgium and Switzerland, driving is also cited as a factor; in Japan, avoiding next-day headaches and staying in control are concerns.”
- The majority of wine drinkers were not actively seeking to purchase no/low alcohol wine, however 30% of younger consumers of regular wine in the United States say they “would definitely prefer to buy a bottle of Champagne that has lower (than 10%) alcohol levels”.
- For regular wine drinkers: Concern about the taste of the wines, the lack of alcoholic effect and poor availability. Linked to poor availability is a lack of knowledge about these wines.
- Lulie Halstead, CEO of Wine Intelligence, notes: “The main barrier to purchasing lower alcohol wine, globally, is that it does not contain enough alcohol to feel an effect. Additionally, European consumers are more likely to not purchase no/low wines because they are not considered to be ‘wine’.”
IWSR’s Research Director, Daniel Mettyear, notes in IWSR (2021): “As we begin seeing more wine producers investing in meeting the growing demand for low- and no- alcohol, their main challenge will be in producing a wine alternative that delivers on taste. This has been a key barrier in non-alcohol wine becoming a mainstream alternative to date.”
Future Growth
IWSR (2022)
- Low-alcohol wine is expected to grow almost +20% CAGR from 2021-2025.
- No-alcohol wine is projected at +9% CAGR.
- “The taste of low-alcohol wine is perceived by many consumers to be superior to that of no alcohol wine.”
MENU
|
HOME
|
SUBSCRIBE |
DIGITAL
|
BEVERAGE
|
NEws and
|
ABOUT |
CONTACT |
©2022 Hawaii Beverage Guide
Terms & Conditions
Terms & Conditions
- Subscribe
- Digital Edition
-
Beverage Guide
- Flavor and Cocktail Construction >
- Production Fundamentals >
- Non-Alcoholic Beverages >
-
Beer
>
- Cider >
- Sake
-
Spirits
>
-
Wine
>
- Kamaʻāina Wine Makers >
-
Winemaking
>
- A Guide to: High Sugar Residual Wines
- A Guide to: Post Fermentation Flavor Adjustments
- A Guide to: Post Fermentation Process: Stabilization
- A Guide to: Wine Prefermentation Practices
- A Guide to: Wine Microbes
- A Guide to: Wine Alcoholic Fermentation Physical Environment
- A Guide to: Wine Fermentation Chemical Environment
- A Guide to: Wine Bottling
- A Guide to: Wine Faults
- A Guide to: Wine Polyphenols
- A Guide to: Wine Aroma Compounds: Pt 1
- A Guide to: Wine Aroma Compounds: Pt 2
- A Guide to Viticulture
- Red and White Grape Aroma Compounds
- Wine Styles >
- Business Strategy
- News and Events
- About
- Production Fundamentals
- Flower Aroma Compounds
- Flavor Pairing and Recipe Development


